In Tinytag Explorer, the kWh figure for data from Tinytag Energy Loggers is calculated for the time/date range currently visible in the graph view.
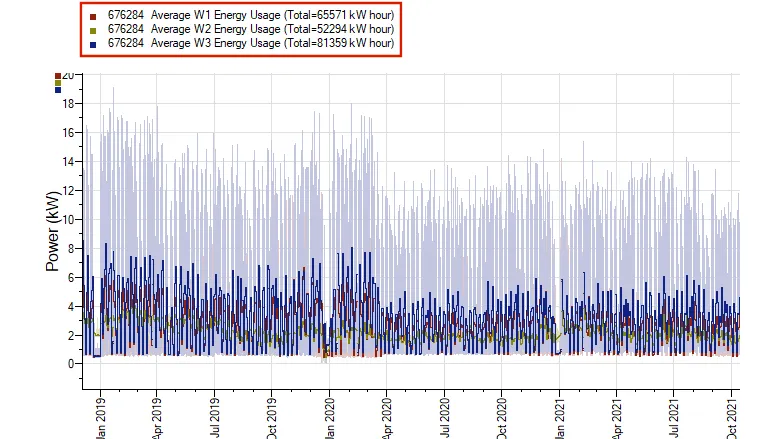
When displaying data downloaded from a Tinytag Energy logger and with the average power traces selected (default), Tinytag Explorer will show a kWh figure for the displayed data. This figure can be found in the graph key near the top of the graph window.
The kWh figure shown is for the time/date range that the graph is currently displaying. This means that if the zoom range of the graph is changed, the kWh figure will update for the new time/date range displayed.
To change the zoom range of a graph to a specific range:
1. Right-click on the graph and select the Graph Configuration option.
2. Go to Page 3 of 3 [Edit Time Bounds] and set the required time and date range.
3. Click Next. The graph will rescale to the new range and show the kWh value for the range entered.
Tinytag Explorer uses a rectangular integration on the individual data points to determine an average value per trace. This is shown as the Average Reading figure in Tinytag Explorer’s Information View (when Average Power Traces are displayed—see above).
This figure is then used to determine the kWh figure for the phase by multiplying it by time (the graph end time minus the graph start time).